Work
These maps and images show what's left of Gaza, 1 year into the Israel-Hamas war
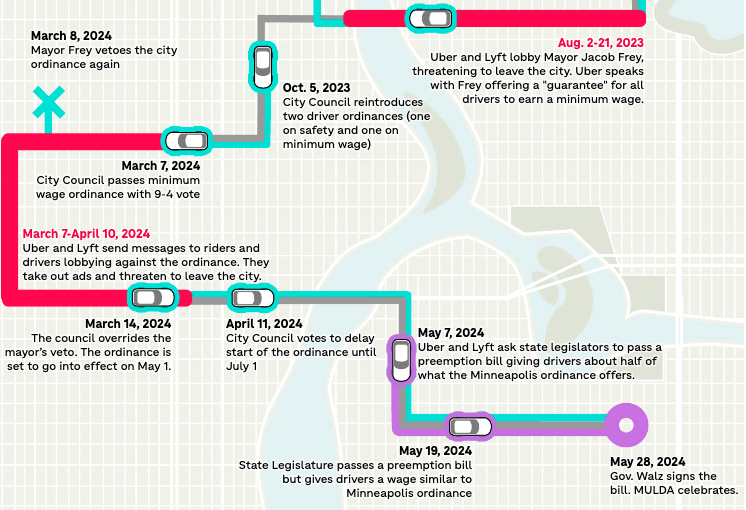
Uber and Lyft are fighting minimum wage laws. But in this state, the drivers won
The USDA’s gardening zones shifted: This map shows you what’s changed in vivid detail
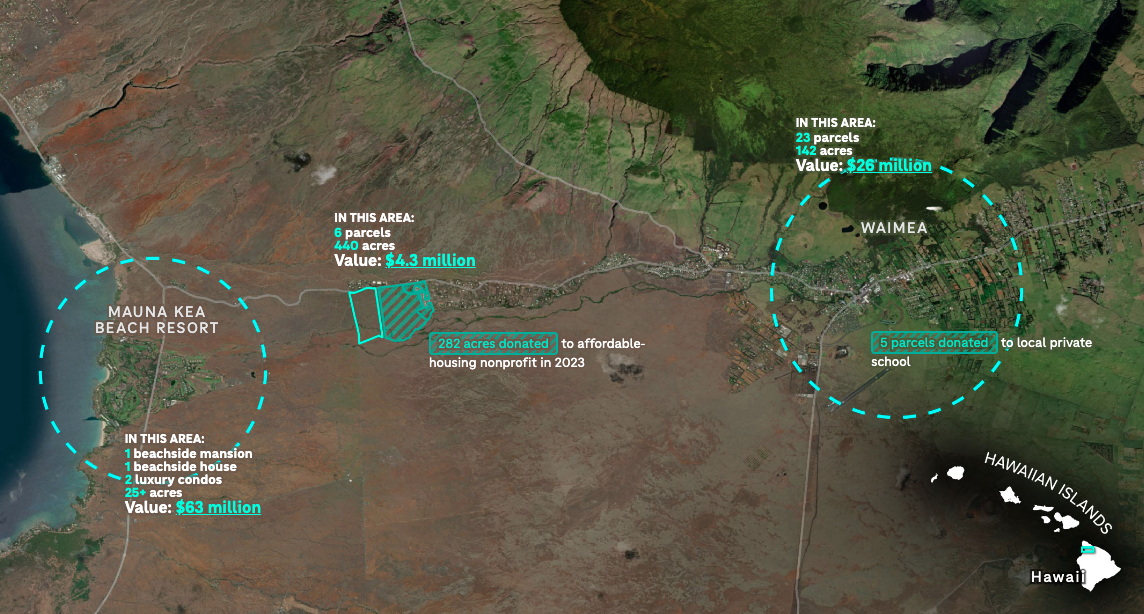
A tech billionaire is quietly buying up land in Hawaii. No one knows why
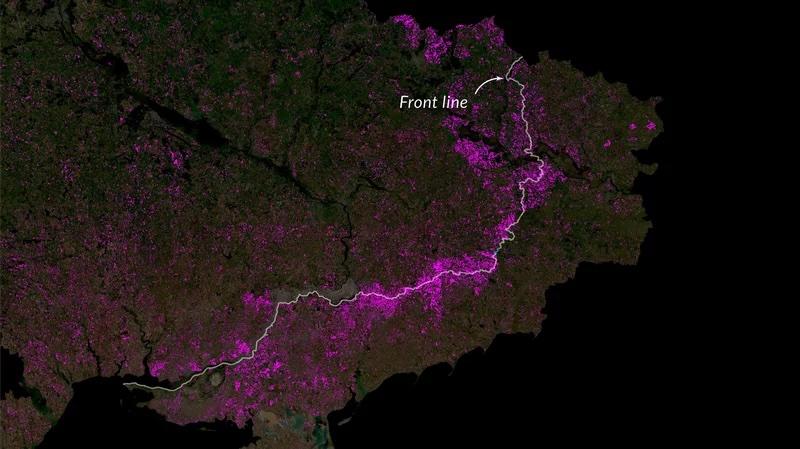
The bruising artillery battle in Ukraine has left a scar that is visible from space
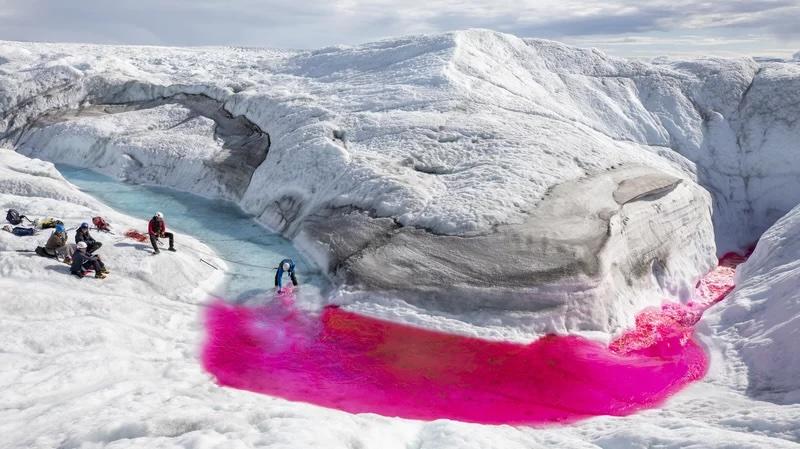
Sea change: How melting ice is disrupting the world’s oceans
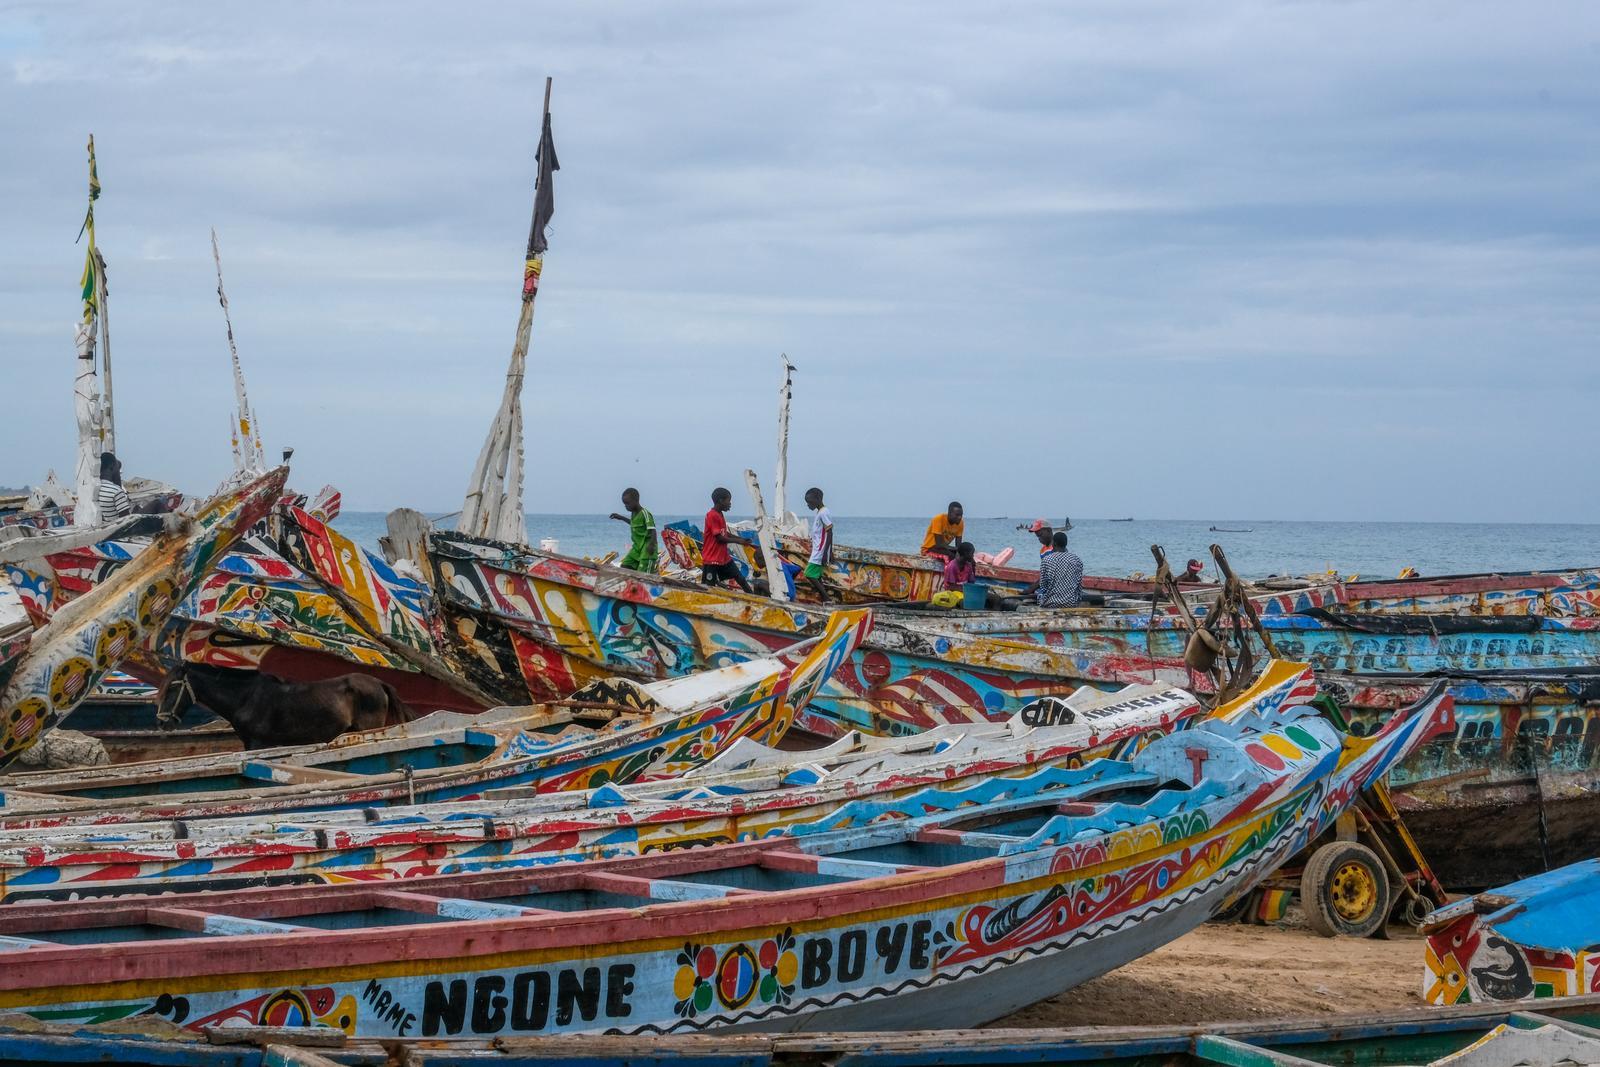
Climate ripples and the rise of the right
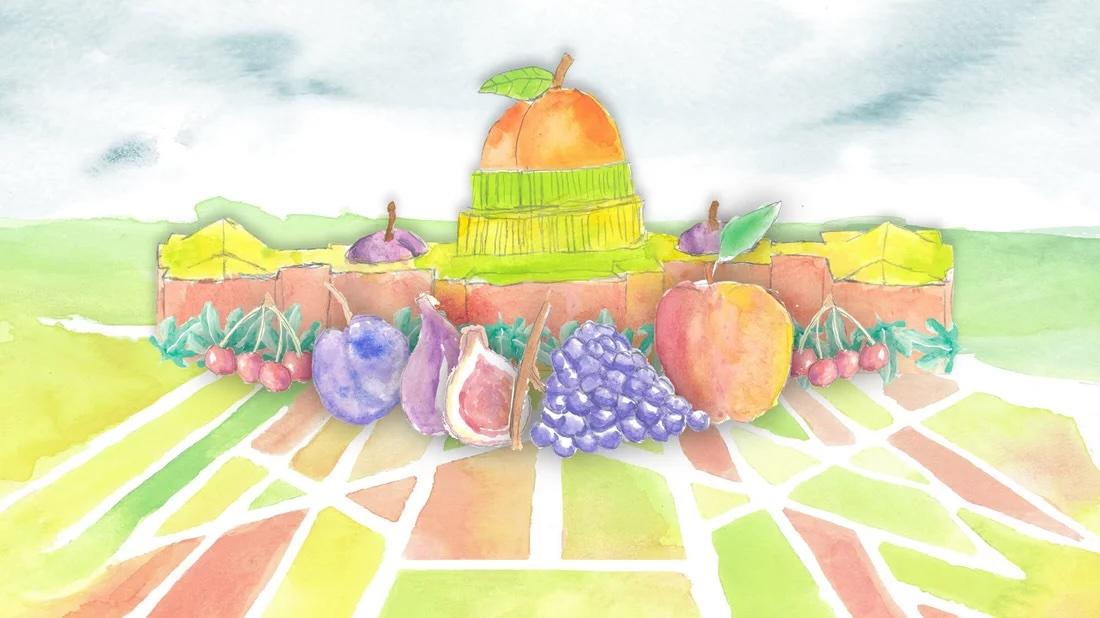
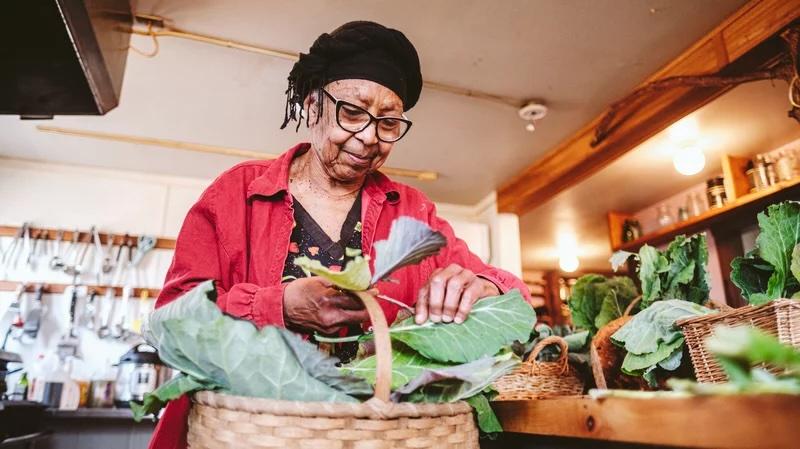
Foraging helped me discover a world of free fruits and veggies
A community of seed savers has a recipe to revive rare varieties of collard greens
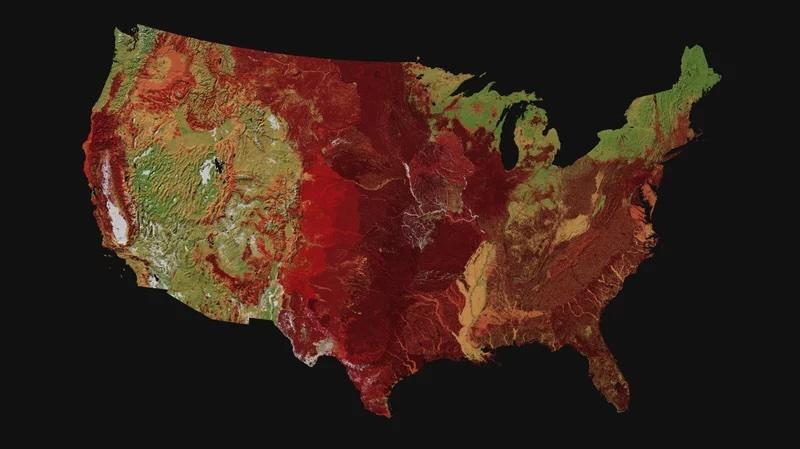
United States of Wildfire
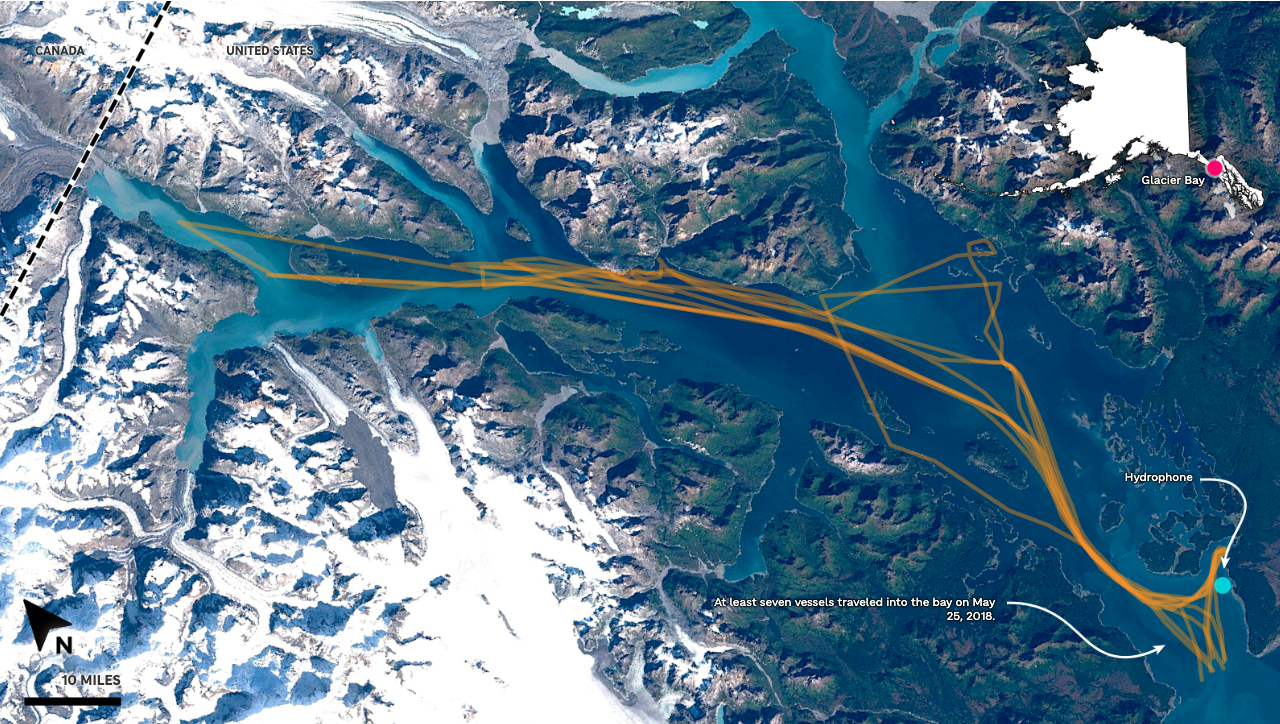
Whales Get A Break As Pandemic Creates Quieter Oceans
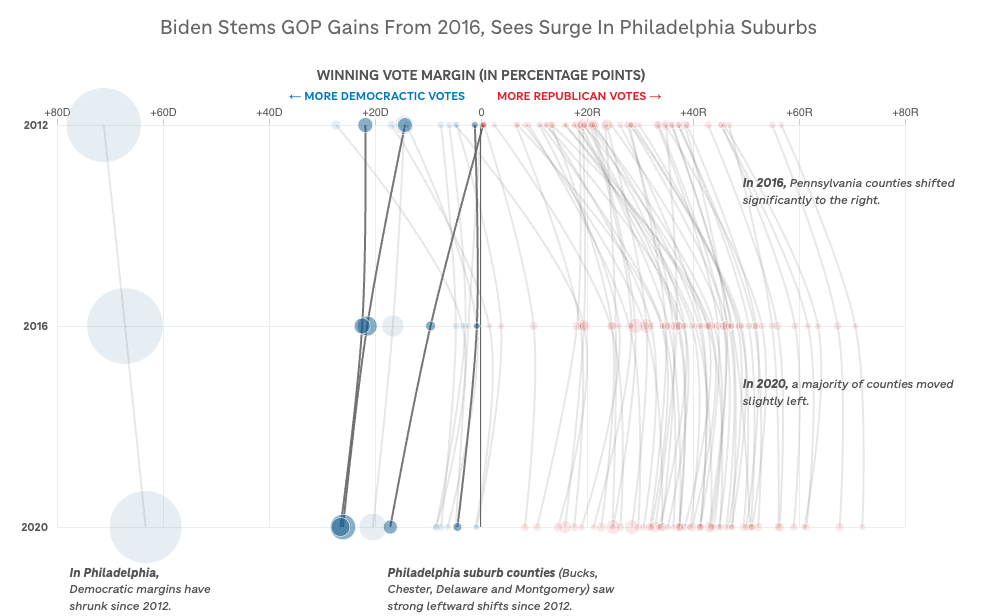
Philadelphia's Suburbs Helped Deliver Crucial Pennsylvania For Biden
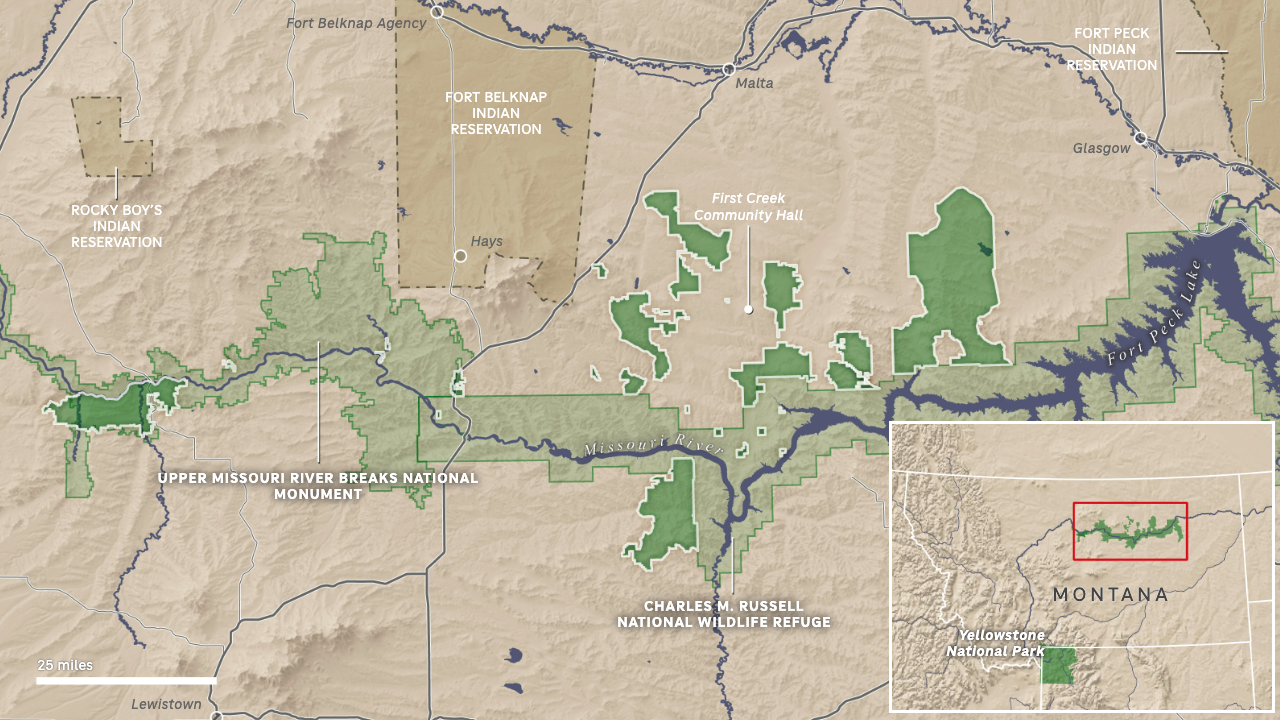
Big Money Is Building A New Kind Of National Park In The Great Plains
Blogs and conference presentations
Self-hosted slippy maps, for novices (like me) [Blog]
If this idiot can self-host his own custom tiles, you can too (for cheap!) [NACIS 2024]
How we used gigabytes of shipping data to show risks to endangered whales [Blog]
How to set up your mac to develop news applications like we do [Blog]
Tools for attractive and fast web-based maps: peaking inside NPR’s workflow [NACIS 2021]
Building a beautiful and clear map from massive, complex data [Blog]
Resume
Professional Experience
Graphics Reporter, NPR
Washington, D.C. | 2019 – present
- Pitch and report stories for NPR.org, podcasts and newsmagazines.
- Cover breaking news events with quick-turn analysis, charts and maps.
- Collaborate with reporters across the newsroom to build deeply reported enterprise features with custom visuals.
- Edit graphics and maps and mentor early career teammates.
- Strategize and build optimized workflows through custom software and chart and map automation.
- Lead team’s adoption of AI to improve coding efficiency.
- Cultivate sources with access to satellite imagery and other high-value data, for rapid response to breaking news and for deeply reported pieces.
- Promote NPR Graphic’s brand and status through conference talks and technical blogs, to help us attract top talent.
Data Visualization Specialist, The Urban Institute
Washington, D.C. | 2017 – 2019
- Built data visualizations, maps, features and data-portals on Urban.org and the Urban Wire blog.
- Guided projects from idea inception, through design and development and on to promotion.
- Utilized a wide variety of front-end tools including D3.js, Mapbox GL js, jQuery and React.
- Improved development stack and team workflow by introducing more modular and time-saving technologies and standards.
Instructor, Data Analysis Bootcamp, George Washington University
Washington, D.C. | 2018 – 2019
- Lead an intensive half year course on data science, data analytics and data visualization.
- Taught and mentored a class of 30 students seeking to build a professional quality portfolio.
- Coursework included a deep dive into Python, Pandas, Matplotlib, SQL, Javascript, D3.js, and an introduction into R, Hadoop, Spark, and machine learning.
Data Visualization Developer, Energy.gov
Washington, D.C. | 2013 – 2017
- Designed and developed over 50 visualizations and story-telling features using D3.js, highcharts.js, mapbox.js, Tilemill and more.
- Wrote popular articles and blogs to supplement data visualizations.
- Produced audio segments for Energy.gov’s Podcast, Direct Current.
Data and Mapping Intern, Development Seed/Mapbox
Washington, D.C. | 2012
- Spent about a month tracing satellite imagery to improve OpenStreetMap data ahead of the launch of Mapbox Streets for their first big client, Foursquare.
- Use census data to create over 800 maps showing election and demographic information for client’s online campaign toolkit.
Skills
Graphics and cartography: Adobe Creative Suite, ai2html, QGIS, mapshaper, GDAL, Blender, Protomaps, Maplibre, Google Earth Engine, Datawrapper, Datawrapper API for automation, Figma
Web development and data analysis: Javascript, D3, Node, Python, Pandas, Jupyter notebooks, CSS, LESS, Git, Bash, SQL, ChatGPT prompt engineering
Education
Boston University | Boston, MA
B.A., magna cum laude, Environmental Policy and Analysis, May 2011
- Francis Bacon Award for Outstanding Writing in the Natural Sciences
Awards
Alfred I. duPont-Columbia University Awards, 2025
Winner, War in Gaza coverage
With NPR’s Gaza coverage team
Society for News Design, 2023
Award of Excellence, Design: Environment and Science
Climate, migration and the far-right: How the ripples of climate change are radiating outward
AAAS Kavli Science Journalism Awards, 2023
Gold Award, Science Reporting, large newsroom
Beyond the Poles: The Far-Reaching Dangers of Melting Ice
Online Journalism Awards, 2023
Winner, Topical Reporting: Climate Change
Climate, migration and the far-right: How the ripples of climate change are radiating outward
Murrow Awards, 2023
Winner, News Series
Climate, migration and the far-right: How the ripples of climate change are radiating outward
Online Journalism Awards, 2022
Finalist, 3M Truth in Science Award
Pro-Trump Counties Now Have Far Higher Covid Death Rates Misinformation is to Blame
Murrow Awards, 2022
Winner, Radio Network category, Digital
NPR’s Covid-19 trackers
Sigma Awards, 2022
Finalist
Who Will Pay to Protect Tech Giants From Rising Seas?
Society for News Design, 2021
Award for Excellence, Design: Environment & Science
United States of Wildfire
About
 Genevieve Huba
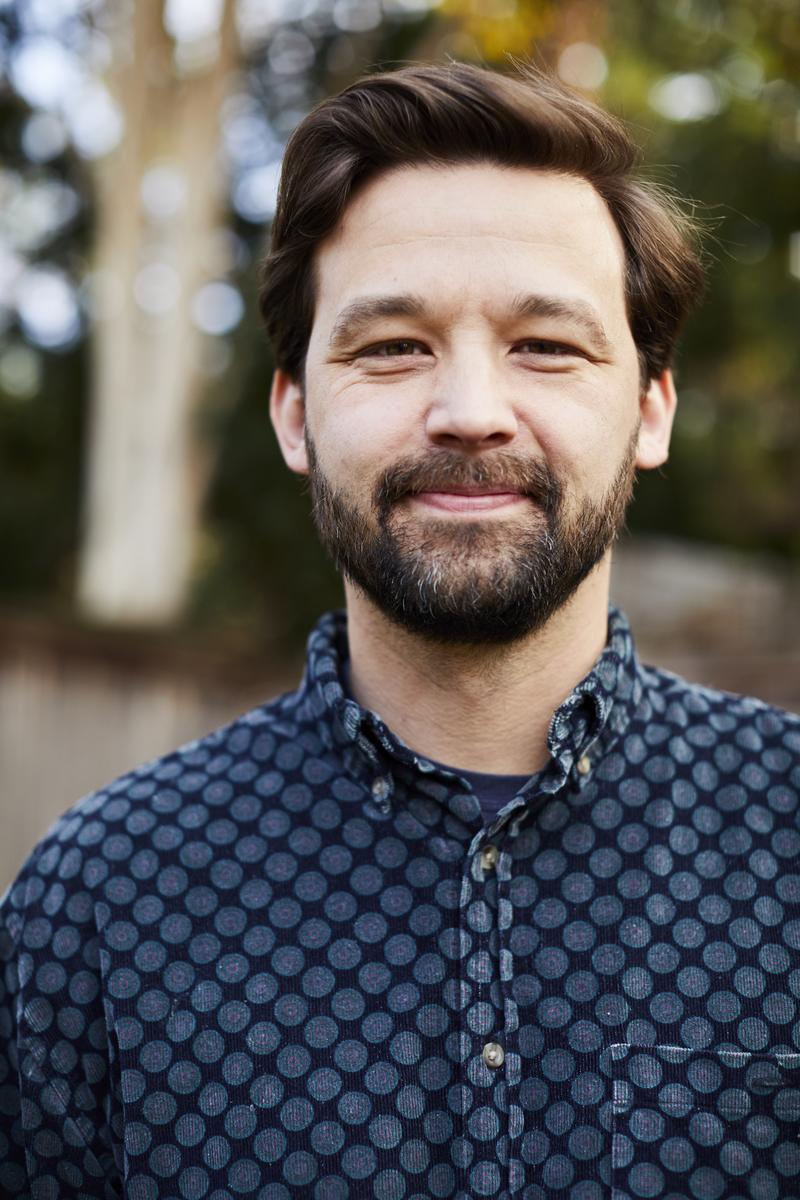
Daniel Wood is a graphics reporter at NPR, where he pairs in-depth reporting with custom maps, charts and visualizations. He focuses on data and imagery-rich topics like climate change, foreign conflicts and politics. His interest in tracking a small outbreak of a novel coronavirus in January 2020 helped position NPR to be among the leading news organizations to provide daily updates on the growth and impact of COVID-19 around the country and globe.
Prior to joining NPR, Wood worked for several years at the Urban Institute, building data visualizations that highlighted and publicized their research.
Wood is a native of Philadelphia. He holds a bachelor’s degree from Boston University in environmental analysis and policy.